


Our Background
RJB has been designing and implementing e-commerce pricing analysis solutions since 2010. Over that period, we’ve also kept a very close watch on Commercial-Off-The-Shelf (COTS) and Software-as-a-Service (Saas) offerings. We understand this problem and the tools available to solve it. We also understand the limitations and applicability of these tools within specific industries.
This article is a brief overview of our experience and capability. We hope you find it useful. For more information, or for advice on your pricing analysis project, don’t hesitate to get in touch.
Also, the results oriented reader can skip the theory and jump to directly to the case study below
Competitor Price Monitoring (CPM)
CPM is the shortest path to improved pricing. In fact, it’s the only option for collecting competitor prices and creating market snapshots. The concept is simple: discover competing products and record your competitor pricing at a fixed frequency. This has been practiced by brick and mortar retailers for decades (“flyer shopping”, “tire kicking”, etc). And you can be sure your e-commerce competitors are using it too.
Benefits of CPM
The primary output of CPM is a rolling snapshot of the current market conditions. Having the high, low, median, and average market prices can obviously help you strategically position your offerings. Over time, however, these market snapshots can be aggregated to illustrate market trends. When performed for a long enough time frame, CPM sheds light on your competitors’ pricing strategies, such as market penetration campaigns, discounting, promotions, and new products.
With respect to internal pricing objectives, CPM allows retailers to be priced, for example, “5% below market average” or “10% less than the competitor X”. Meeting objectives like this can be critical to larger pricing campaigns, such as market penetration. Moreover, the analysis of competitor price history can give insight into the long term pricing objectives of competitors. This information can be used to iteratively refine internal objectives.
CPM also has the benefit of being unintrusive, meaning it doesn’t need to “integrate” with your e-commerce store. This translates into major savings on startup costs and development. In fact, small e-commerce operations can easily get started with a 3rd party vendor. Medium and large e-commerce operations, however, face additional challenges.
Implementing CPM
Medium and large e-commerce operations present additional challenges for CPM. These challenges are largely issues of scale. However, complexity increases with certain requirements specific to larger companies. Consider the following challenges:
Increased Products/SKUs – Today, even small online stores can have 10’s of thousands of products. As of 2015, Amazon.com was selling 488 million products! The reality is, 3rd party vendors just don’t scale with a Long Tail business model.
Market Growth – The writing is on the wall here: the entire e-commerce market is growing steadily. Moreover, increasing SKUs means competing in a much larger segment of that market. Scaling with this growth – tracking existing competitors and discovering new ones – is typically beyond the capability of SaaS vendors.
Dynamic Pricing & A/B Tests – Many sites adjust prices in real-time, based on individual customer history. Almost all sites are conducting A/B Tests, distributing customers across different versions of the same site. This effectively multiplies the effort required to shop a competitor. In addition, it obfuscates the overall price strategy.
Multi-Channel – In addition to dynamic stores, many retailers are using multiple sales channels. Comparison Shopping Engines (CSEs) are very common example of this. Again, the effort to monitor prices is multiplied and the overall price strategy is obfuscated.
The aforementioned challenges are specific to CPM. However, medium and large e-commerce operations are typically interested in a lot more than just price data. Since effort is already being expended to locate and collect competitor prices, it makes sense to collect the additional data at the same time. This presents additional challenges for SaaS.
Prices are Compact – Collecting and delivering price data is a low bandwidth problem. Adhoc data collection, e.g. product reviews or images, has a much larger footprint. To put this in perspective, a compressed CSV file containing 50,000 product prices occupies a few hundred kilobytes of space. A single product page at Amazon.com, however, is several megabytes. SaaS simply can’t deliver the wealth of competitor data available on the web.
Moving Targets – Competitors adjust their content and format constantly. With respect to collecting pricing data, this is a manageable problem for SaaS. However, it doesn’t scale for adhoc data collection. The more data collected, the harder it becomes to stay in sync with competitor changes.
RJB Approach
Our approach to high volume CPM makes 2 major departures from main stream solutions. First, the entire process is workflow driven, where tasks are delegated to the most suitable ‘agent’. The key is to find the optimal human-machine collaboration point, maximizing accuracy and throughput, while minimizing cost. This collaboration point isn’t fixed, it changes with the limits of machine intelligence.
This leads to our second departure – machine learning. Automation is the goal, as it saves time and money. However, machine limitations force humans to occasionally step into the workflow. This presents a great opportunity to train the machine. Over time, the system drives itself toward full automation.
Before we describe the process in detail, here’s a conceptual view of round trip CPM, from the inclusion of a new product to the generation of optimized prices:
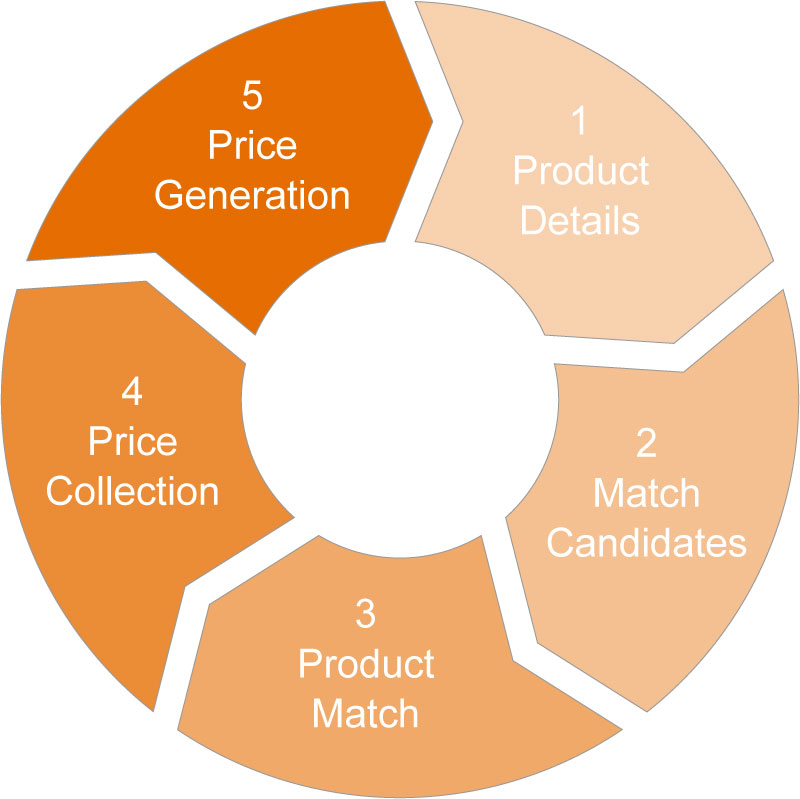
1. Product Details
The goal of this step is to collect enough product data to produce viable search keywords. Our best results have come from combining multiple data collection techniques. For example, product identifiers (UPC, EAN, ISBN, etc.), descriptions, specifications, etc. can often be ‘scraped’ from the production e-commerce site by machine agents. These results can be augmented by internal users and offline product data. Crowd sourcing can also be introduced to capture alternate product descriptions, word associations, etc. With a workflow based architecture, it’s incredibly easy for humans and machines to collaborate on product details.
2. Match Candidates
This step produces a collection of URLs for potential competing products. Search keywords from the previous step are executed on general purpose engines (Google, Bing, Yahoo, etc.), and on known competitor sites. Search results are crawled in a ‘drill down’ fashion until product detail pages are reached. Again, this is highly automated. Humans only step in when the machine can’t make sense of something; and when this happens, the machine learns from the human interaction.
3. Product Match
This step produces a match confidence for each match candidate identified in the previous step. It also identifies competitors by association i.e. when a product match is found on a new competitor. While this is an easy task for humans, it’s the most difficult step to automate in CPM. Our approach to automatic matching is private intellectual property. However, as mentioned above, when a human steps into this workflow, the machine learns from it.
4. Price Collection
This step produces price data for each competing product identified in the previous step. It’s the second most difficult step to automate in CPM, as the complexity varies across markets and competitors. For example, Business-to-Business (B2B) operations often have tiered pricing. Business-to-Customer (B2C) operations often have hidden fees, variable shipping costs, etc. that are not available until checkout confirmation. In either case, machines can eventually be taught to ‘scrape’ this data.
5. Price Generation
This step produces new ‘optimal’ prices. It’s almost always automated. Price generation is not exclusive to CPM, however, CPM unlocks certain pricing objectives mentioned above. If these objectives meet your needs, you can stop here and generate prices. However, as we describe below, additional methods can be used to collect more data and unlock new pricing strategies.
A Few Remarks
Steps 1 to 3 are discovery activities, and they are performed once when a product is included in CPM. They may be performed periodically, but with a reasonably low frequency. Steps 4 & 5 are operational activities. They are performed very frequently, sometimes as often as hourly.
Price Elasticity of Demand (PED)
While CPM can deliver market snapshots and competitor pricing trends, it says nothing about the affect of price changes on sales demand. This relationship, formally known as Price Elasticity of Demand (PED), is the key to unlocking additional goal driven price strategies. It can be summarized as follows: holding other factors equal, if the price is changed by X%, sales demand will change by Y%.
The results oriented reader will find an example PED curve in the case study below.
Benefits of PED
The first pricing objective unlocked by PED is Revenue Optimization. This is achieved by simply choosing the point on the PED curve where sales demand is highest. It’s very straight forward to implement, however, with the exception of market penetration campaigns, it’s a naive business objective, as it doesn’t account for sales margins. Simply stated, revenue optimization will almost always increase sales and decrease profit per sale.
A more sophisticated PED based approach is Profit Optimization. This method factors in sales costs to generate prices that maximize profit. Profit optimization can also deliver new business insight. For example, an optimal solution could be to sell less units at a much greater margin, an approach that isn’t always intuitive.
For many retailers, profit optimization is almost as simple as revenue optimization, because calculating costs is simple. However, in certain industries, including many B2B niches, profit optimization involves computing complex costs. For example, B2B retailers often receive volume based (i.e. tiered) prices from their suppliers. They also offer volume based prices to their customers. Profit optimization must factor in all fixed and variable elements to deliver an accurate solution.
Determining PED
Unlike CPM, which evaluates the external competition, PED is determined by measuring the performance of your own products and prices. As a result, accurately determining PED can be more intrusive than CPM. Consider the following options:
Sales History – A baseline PED relationship can be derived from existing sales history. Like CPM, this has the benefit of being completely unintrusive. Unfortunately it’s not very accurate. Sales history typically doesn’t contain context information, such as active promotions or market conditions at the time of sale. In short, this approach can’t satisfy the “holding other factors equal” requirement.
Market Research, Surveys & Crowd Sourcing – PED can also be determined via market research. This is a middle ground approach, that mitigates some of the contextual issues of sales history analysis. It also remains unintrusive and it’s reasonably easy to deploy. For example, deploying a pricing survey to Amazon Mechanical Turk is relatively quick and easy. On the other hand, data quality is very dependent on survey design and crowd segmentation. A survey must ask the right people the right questions, or the data can’t be trusted. It’s also important to keep in mind that survey participants have very little “skin in the game”. Asking an individual what they would pay is different than having them pay it.
A/B Testing – A practical way to determine PED is by real-time pricing experiments. Using A/B Testing, customers are distributed across multiple versions of the store, where each version has different pricing. The test is run for a fixed length of time, and the performance (i.e. sales) of the each store version is evaluated. A/B price testing works because it satisfies the “holding other factors equal” requirement, while overcoming the “skin in the game” deficiency of market research approaches. On the other hand, A/B price testing is more difficult to deploy, particularly if your e-commerce platform doesn’t support it. It’s also important to note that these price tests will affect your actual sales, and they can last for weeks or months when slow sellers are measured (i.e. Long Tail sales).
A Case Study in the Promotional Products Industry
RJB was involved in conception through to delivery of a new pricing system for a large e-commerce retailer. The customer is a multi-million dollar B2B retailer of promotional products. They offer 15000+ products, with different charge models for various custom logo methods. They also offer tiered pricing to customers and receive volume based supplier costs. They ship internationally. Due the the financial nature of this case, the customer chose not to be identified.
| Phase 1 | |
|---|---|
| Objective | Increase Gross Revenue with a Market Penetration campaign to be the lowest price in the industry. |
| Strategy | Implement Competitor Price Monitoring to discover market conditions and undercut the competition. |
| Solution | RJB designed and implemented an in-house CPM system. The system includes a software platform for identifying competitors and competing products, as well as for regular daily price monitoring of known products. |
| Result | The customer maintained the lowest price in the industry
for 9 months. As a result:
|
| Phase 2 | |
| Objective | Capitalize on increased market share (Phase 1) by implementing Profit Optimization |
| Strategy | Execute A/B price testing to discover Price Elasticity of Demand and Optimize Profit. Perform daily profit optimization for 15000+ products with volume based supplier costs and tiered end user pricing. |
| Solution | RJB designed and delivered a Profit Optimization system to
manage all products sold. The system consumes:
|
| Result | After a year of Profit Optimization:
|
As you can imagine, this project was considered a major success. The customer not only exceeded target market share gains, they retained these gains through a subsequent year of profit optimized prices, generating millions in top line revenue and an increase in gross profitability of 21.6% across sales of all products.
Example PED Curve
Here’s a example PED curve from the case study project. NOTE: on this project, PED was commonly referred to as “Price Sensitivity”:
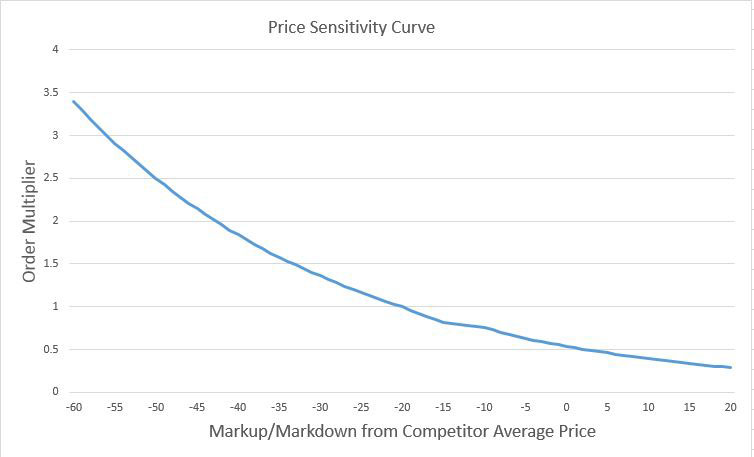
There are a few interesting details to note here. First, the units used to describe this PED relationship are relative. The X-axis represents the percentage markup or markdown from the competitor price average. The Y-axis represents the increase or decrease in the number of orders, as a multiplier from the baseline expected number of orders. Keep in mind that this is not the only way to describe the PED relationship. However, this was the method used in the case study project.
Looking at the curve itself, we can see that an Order Multiplier of 1 (i.e. the baseline number of orders) corresponds to a markdown of 20%. This is due to the Phase 1 market penetration campaign. After the campaign, the standard price for this retailer was 20% below market average.
Final Remarks
Although it doesn’t directly pertain to CPM, it’s important to note that there was an immediate Phase 3 follow up to this project, where RJB was tasked with collecting an additional 18-20 pieces of data (e.g. shipping costs, decoration charges, etc.) while performing CPM. Fortunately, the system architecture allowed us to keep up with the increased data volume and moving targets.